exercise 5.5
ZIP with MATLAB scripts and note:
exercise 5.5 notes:
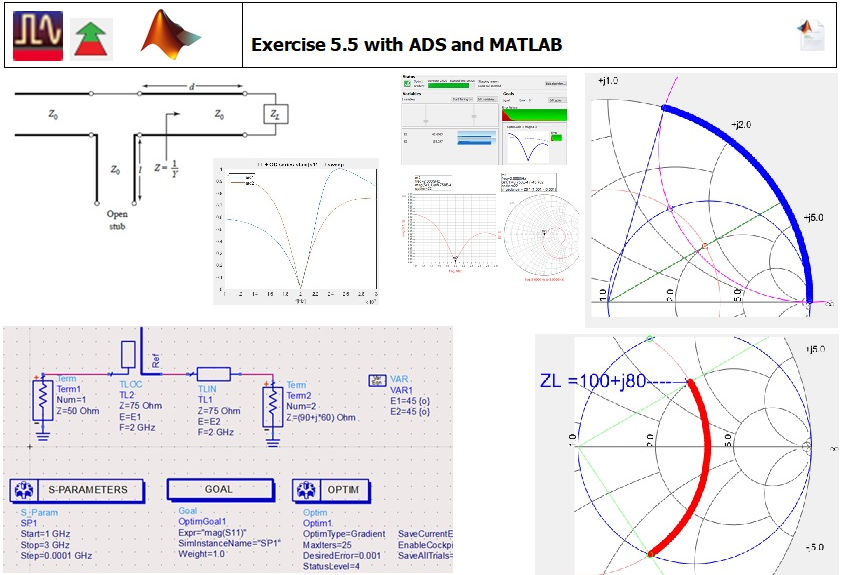
Solving exercise 5.5 with the ADS Optimizer
Single series open circuit stub match
E1(º) is l, D OC stub, D2: open circuit series stub electric length.
E2(º) is d, D Transmission Line, D1: series transmission line electric length.
Comment:
On the right hand side, ADS optimiser apparently accepts variable var_name into the optimiser by simply adding var_name {o}, but the optimiser doesn't start until keying in 'var_name unit opt{a unit to b unit}' where b>a, having previously changed Variable Eq entry mode to Name=Value.
Single series open circuit stub ZL=90+1j*60;Z0=75
Starting optimizer with E1=E2=45º resulting: E1=62.6º E2=155.24º 22 iterations
E = [ 62.6 155.24];D=E/360
D1 = 0.173888888888889 0.431222222222222
Starting optimizer with E1=E2=12º
Result: E1=297.27º E2=260.86º after 15 iterations
E1=297.27º E2=260.86º
E = [297.27 260.86];D=E/360
D = 0.825750000000000 0.724611111111111
Starting optimizer with E1=E2=90º
Result: E1=117.29º E2=80.86º after only 2 iterations
E1=117.29º E2=80.86º
E = [117.29 80.86];D=E/360
D = 0.325805555555556 0.224611111111111
where D is lambda wavelength fraction.


exercise 5.5 with MATLAB
reusing code from 5.3, the lines below
gamma_ZL_angle=angle(gamma_ZL);gamma_ZL_mod=abs(gamma_ZL)
if gamma_ZL_angle<0 gamma_ZL_angle=2*pi+gamma_ZL_angle; end
if gamma_ZL_angle>(2*pi) gamma_ZL_angle=gamma_ZL_angle-2*pi; end
Smith_plotZ(ax(1),ZL,Z0,[1 0 0])
replaced with just the line below.
The 4 lines on left hand side now in function Smith_plotZ
[gamma_ZL_angle,gamma_ZL_mod]=Smith_plotZ(ax(1),ZL,Z0,[1 0 0],1)
Calculating D1_TL
Z0=75; ZL=90+1j*60;
gamma_ZL=(ZL-Z0)/(ZL+Z0);
hf(1)=figure(1);sm(1)=smithchart;ax(1)=hf(1).CurrentAxes;hold(ax(1),'on')
Smith_plotZ(ax(1),ZL,Z0,[1 0 0],1)
Smith_plotRefLine2PhaseCircle(ax(1),ZL,Z0,[.6 1 .6])
[x_swr,y_swr]=Smith_plotGammaCircle(ax(1),ZL,Z0,[1 .6 .6])
[xr1,yr1]=Smith_plotRcircle(ax(1),Z0,Z0,[0 0 1])
[xint,yint]=intersections(x_swr,y_swr,xr1,yr1,1);
plot(ax(1),xint,yint,'go')
refl_zx1=xint(1)+1j*yint(1);
refl_zx1_angle=angle(refl_zx1);refl_zx1_mod=abs(refl_zx1)
if refl_zx1_angle<0 refl_refl_zx1_angle=2*pi+refl_zx1_angle; end
if refl_zx1_angle>(2*pi) refl_zx1_angle=refl_zx1_angle-2*pi; end
% check
Z_1=Z0*(1+refl_zx1)/(1-refl_zx1)
real(Z_1)
Smith_plotRefLine2PhaseCircle(ax(1),Z_1,Z0,[.6 1 .6])
da=1/100;arc1=da
a0=gamma_ZL_angle;a1=refl_zx1_angle;gamma_mod=gamma_ZL_mod
a0*180/pi
a1*180/pi
if a0<0 a0=2*pi+a0; end % avoid start with any negative angle
if a0>(2*pi) a0=a0-2*pi; end
if a1<1 a1=2*pi+a1; end
if a1>(2*pi) a1=a1-2*pi; end
% preventing while loop missing target because step not small enough
a0=da*floor(1/da*a0)
a1=da*floor(1/da*a1)
while da*floor(1/da*abs(a0-a1))>da
a0=a0-da;arc1=arc1+da;
if a0<0 a0=2*pi+a0; end % avoid negative angles
if a0>(2*pi) a0=a0-2*pi; end
gamma=gamma_mod*(cos(a0)+1j*sin(a0));
plot(ax(1),real(gamma),imag(gamma),'ro','LineWidth',1.5);
% drawnow
end
plot(ax(1),xint,yint,'go')
% checking stub input impedance already on r=1 circle
Z_1
isequal(da*floor(1/da*real(Z_1)),…
da*floor(1/da*real(Z0)))
D1_TL_lambda=arc1/(4*pi)
D1_TL_angle_deg=D1_TL_lambda*180/.5
lambda/2 is 180º electric length that in turn is 360º on Smith Chart
..

Calculating D2_TL
hf(2)=figure(2);sm(2)=smithchart; ax(2)=hf(2).CurrentAxes; hold(ax(2),'on')
gamma_ZL=Smith_plotZ(ax(2),ZL,Z0,[1 0 0],0)
Smith_plotRefLine2PhaseCircle(ax(2),ZL,Z0,[.6 1 .6])
[x_swr,y_swr]=Smith_plotGammaCircle(ax(2),ZL,Z0,[1 .6 .6])
[xr1,yr1]=Smith_plotRcircle(ax(2),Z0,Z0,[0 0 1])
plot(ax(2),xint,yint,'go')
refl_zx2=xint(2)+1j*yint(2); % 2nd intersection point
refl_zx2_angle=angle(refl_zx2);refl_zx2_mod=abs(refl_zx2)
if refl_zx2_angle<0 refl_refl_zx2_angle=2*pi+refl_zx2_angle; end
if refl_zx2_angle>(2*pi) refl_zx2_angle=refl_zx2_angle-2*pi; end
% check
Z_2=Z0*(1+refl_zx2)/(1-refl_zx2)
real(Z_2)
Smith_plotRefLine2PhaseCircle(ax(2),Z_2,Z0,[.6 1 .6])
da=1/100;arc2=da
a0=gamma_ZL_angle;a1=refl_zx2_angle;gamma_mod=gamma_ZL_mod
if a0<0 a0=2*pi+a0; end % avoid starting with negative angles
if a0>(2*pi) a0=a0-2*pi; end
if a1<1 a1=2*pi+a1; end
if a1>(2*pi) a1=a1-2*pi; end
a0=da*floor(1/da*a0)
% this prevents while loop spinning endlessly if step not small enough
a1=da*floor(1/da*a1)
while da*floor(1/da*abs(a0-a1))>da
a0=a0-da;arc2=arc2+da;
if a0<0 a0=2*pi+a0; end % avoid negative angles
if a0>(2*pi) a0=a0-2*pi; end
gamma=gamma_mod*(cos(a0)+1j*sin(a0));
plot(ax(2),real(gamma),imag(gamma),'ro','LineWidth',1.5);
% drawnow
end
plot(ax(2),xint,yint,'go')

checking stub input impedance already on r=1 circle
Z_2
isequal(da*floor(1/da*real(Z_2)),…
da*floor(1/da*real(Z0)))
D2_TL_lambda=arc2/(4*pi)
D2_TL_angle_deg=D2_TL_lambda*180/.5
=
75.003511824677943 +56.434078007705629i
=
logical
1
D2_TL_lambda =
0.480647928137517
D2_TL_angle_deg =
1.730332541295062e+02
Calculating stub lenght Dstub1
hf(3)=figure(3);sm(3)=smithchart; ax(3)=hf(3).CurrentAxes; hold(ax(3),'on');
gamma_ZL=Smith_plotZ(ax(3),ZL,Z0,[1 0 0],0)
Smith_plotRefLine2PhaseCircle(ax(3),ZL,Z0,[.2 .6 .2])
[x_swr,y_swr]=Smith_plotGammaCircle(ax(3),ZL,Z0,[1 .6 .6])
[xr1,yr1]=Smith_plotRcircle(ax(3),Z0,Z0,[0 0 1])
plot(ax(3),xint,yint,'go')
% 1st intersection
refl_zb1=xint(1)+1j*yint(1);
refl_zb1_angle=angle(refl_zb1);refl_zb1_mod=abs(refl_zb1)
if refl_zb1_angle<0 refl_zb1_angle=2*pi+refl_zb1_angle; end
if refl_zb1_angle>(2*pi) refl_zb1_angle=refl_zb1_angle-2*pi; end
Zbs=Z0*((1+refl_zb1)/(1-refl_zb1))
refl_zstub=conj(refl_zb1) % where stub imag(Zin) has to be
plot(ax(3),real(refl_zstub),imag(refl_zstub),'bo')
Zbs2=Z0*(1+refl_zstub)/(1-refl_zstub)
Smith_plotBarc(ax(3),Zbs2,Z0,[1 0 1]) % reading stub reactance
Zbs3=1j*imag(Zbs2)
refl_Zstub=(Zbs3-Z0)/(Zbs3+Z0)
plot(ax(3),real(refl_Zstub),imag(refl_Zstub),'ro')
Smith_plotRefLine2PhaseCircle(ax(3),Zbs3,Z0,[.2 .2 .8])
% Z Smith chart -pi: SC 0: OC. Y Smith chart 0: SC -pi: OC
da=1/100;a_stub=[angle(refl_Zstub):-da:0];arc_stub1=da;
for k=1:1:numel(a_stub)
gamma_stub=cos(a_stub)+1j*sin(a_stub);
arc_stub1=arc_stub1+da;
plot(ax(3),real(gamma_stub),imag(gamma_stub),'bo','LineWidth',1.5);
end
arc_stub1=arc_stub1-da;
% from the arc on Smith chart
arc_stub1_lambda=.25/pi*arc_stub1
% same as
Dstub1_lambda=arc_stub1/(4*pi)
Dstub1_angle_deg=arc_stub1/2*360/(2*pi)

Calculating stub lenght Dstub2
hf(4)=figure(4);sm(4)=smithchart; ax(4)=hf(4).CurrentAxes; hold(ax(4),'on');
gamma_ZL=Smith_plotZ(ax(4),ZL,Z0,[1 0 0],0)
Smith_plotRefLine2PhaseCircle(ax(4),ZL,Z0,[.2 .6 .2])
[x_swr,y_swr]=Smith_plotGammaCircle(ax(4),ZL,Z0,[1 .6 .6])
[xr1,yr1]=Smith_plotRcircle(ax(4),Z0,Z0,[0 0 1])
plot(ax(4),xint,yint,'go')
% 2nd intersection
refl_zb2=xint(2)+1j*yint(2);
refl_zb2_angle=angle(refl_zb2);refl_zb2_mod=abs(refl_zb2)
if refl_zb2_angle<0 refl_zb2_angle=2*pi+refl_zb2_angle; end
if refl_zb2_angle>(2*pi) refl_zb2_angle=refl_zb2_angle-2*pi; end
Zbs=Z0*((1+refl_zb2)/(1-refl_zb2))
refl_zstub=conj(refl_zb2) % where stub imag(Zin) has to be
plot(ax(4),real(refl_zstub),imag(refl_zstub),'bo')
Zbs2=Z0*(1+refl_zstub)/(1-refl_zstub)
Smith_plotBarc(ax(4),Zbs2,Z0,[1 0 1]) % reading sought stub reactance
Zbs3=1j*imag(Zbs2)
refl_Zstub=(Zbs3-Z0)/(Zbs3+Z0)
plot(ax(4),real(refl_Zstub),imag(refl_Zstub),'ro')
Smith_plotRefLine2PhaseCircle(ax(4),Zbs3,Z0,[.2 .2 .8])
angle_refl_Zstub=angle(refl_Zstub) % avoid negative angles
if angle_refl_Zstub<0 angle_refl_Zstub=2*pi+angle_refl_Zstub; end
if angle_refl_Zstub>(2*pi) angle_refl_Zstub=angle_refl_Zstub-2*pi; end
% Z Smith chart -pi: SC 0: OC, Y Smith chart 0: SC -pi: OC
da=1/100;a_stub=[angle_refl_Zstub:-da:0];arc_stub1=da;
for k=1:1:numel(a_stub)
gamma_stub=cos(a_stub)+1j*sin(a_stub);
arc_stub1=arc_stub1+da;
plot(ax(4),real(gamma_stub),imag(gamma_stub),'bo','LineWidth',1.5);
end
arc_stub1=arc_stub1-da;
% from the arc on Smith chart
arc_stub1_lambda=.25/pi*arc_stub1
% same as
Dstub1_lambda=arc_stub1/(4*pi)
Dstub1_angle_deg=arc_stub1/2*360/(2*pi)

arc_stub1_lambda = 0.148014097075463
Dstub1_lambda = 0.148014097075463
Dstub1_angle_deg = 53.285074947166599
arc_stub2_lambda = 0.353323973664004
Dstub2_lambda = 0.353323973664004
Dstub2_angle_deg = 1.271966305190413e+02
Frequency Sweep
Putting transmission line and stub lengths together
D=[D1_TL_lambda D2_TL_lambda;
Dstub2_lambda Dstub1_lambda]
Let be the following f0 and band:
c0=2.998e8;
f0=2e9;
df=1e5;f1=1e9;f2=3e9;f=[f1:df:f2];
Then the physical lengths of all transmission lines and stubs are:
L=D*c0/f0
s11=zeros(size(D,2),numel(f));
ZinTL=zeros(size(D,2),numel(f));
Zin_stb_oc=zeros(size(D,2),numel(f));
Zin=zeros(size(D,2),numel(f));
for k=1:1:size(L,2)
ZinTL(k,:)=Z0*(ZL+1j*Z0*tan(2*pi*f/c0*L(1,k)))./…
(Z0+1j*ZL*tan(2*pi*f/c0*L(1,k))); % series transmission line
end
for k=1:1:size(D,2) % open circuit shunt stub
Zin_stb_oc(k,:)=Z0./(1j*tan(2*pi*L(2,k)*f/c0));
impedance
end
Zin=ZinTL+Zin_stb_oc;
s11=(Zin-Z0)./(Zin+Z0);
s11_mod=abs(s11);
hf(10)=figure(10);
plot(f,s11_mod(1,:));plot(f,s11_mod(2,:));grid on
for k=1:1:size(s11_mod,1)
hf(10)=figure(10);plot(f,s11_mod(k,:));hold all;
end
grid on
title('TL + OC series stub |s11| - f sweep');xlabel('f[Hz]')
legend('arc1','arc2','eq1','eq2','Location','northwest')
D =
0.231397640694349 0.424104164889466
0.148014097075463 0.353323973664004
L =
0.034686506340083 0.063573214316931
0.022187313151612 0.052963263652234

There's also an alternative graph to find the required transmission line and stub lengths; |s11| surface.
clc;clear all;close all
ZL=90+1j*60;Z0=75;
Dstep=.001;drange=[0:Dstep:1];
D1=drange;D2=D1;
[D1,D2]=meshgrid(drange);
Z1=Z0*(ZL+1j*Z0*tan(2*pi*D1))./(Z0+1j*ZL*tan(2*pi*D1));
Zin_stub=Z0./(1j*tan(2*pi*D2)); % series oc stub
Zin=Z1+Zin_stub;
s11=(Zin-Z0)./(Zin+Z0);
surf(abs(s11),'LineStyle','none')
ax=gca
xlabel('D1');ylabel('D2');
ax.XTickLabelMode='manual'; ax.YTickLabelMode='manual';
ax.XTickLabel=[0:0.1:1];ax.YTickLabel=[0:0.1:1];
ax.XTick=[0:100:1000];ax.YTick=[0:100:1000];
ax.PlotBoxAspectRatio=[1 1 1]
hold all;x0=find(drange==.5) % plotting corner to box D1<.5 D2<.5
plot3([x0 x0 0],[0 x0 x0],[5 5 5],'Color',[1 0 0],'LineWidth',3)
% moving camera birdeye view
ax.CameraPosition=[500 500 10]
camzoom(ax,1.5) % zoom in a bit, camzoom is cumulative
% zoom_factor within [0 1) zooms out zoom_factor>1 zooms in
ax.CameraUpVector = [0 1 0]; % camera attitude
ax.CameraTarget = [500 500 0]; % centring
ax.CameraViewAngle =8*pi; % focus
automating peaks capture: findpeaks with MinPeakProminence=2.5 returns the right amount of peaks. MinPeakProminence larger or smaller than 2.5 then either too few or too many peaks.
With MinPeakHeight=2 command findpeaks doesn't catch the right amount of peaks for any MinPeakDistance, going from 6 peaks only to too many peaks.
With Threshold=2 doesn't catch a single peak but Threshold=1 gets the right amount of peaks.


To get zeros exact locations, it's useful to invert |s11| surface just plotted, with the Laplacian of the surface, command del2
V=1e3*del2(abs(s11));
figure(2);ax=gca;surf(V,'Lines','none');
xlabel('D1');ylabel('D2');
ax.XTickLabelMode='manual';
ax.YTickLabelMode='manual';
ax.XTickLabel=[0:0.1:1];ax.YTickLabel=[0:0.1:1];
ax.XTick=[0:100:1000];ax.YTick=[0:100:1000];
[pks,locs]=findpeaks(V( : ),'Threshold',1);
[nd1,nd2]=ind2sub(size(V),locs);
hold all;figure(2);plot3(nd2,nd1,V(nd2,nd1)+2,'ro'); % plot peaks
ax.PlotBoxAspectRatio=[1 1 1]
x0=find(drange==.5) % plot corner to box D1<.5 D2<.5
figure(2);
plot3([x0 x0 0],[0 x0 x0],[.5 .5 .5],'Color',[1 0 0],'LineWidth',3)
ax2=gca
ax2.CameraPosition=[500 500 10] % moving camera birdeye view
ax2.CameraUpVector = [0 1 0]; % camera attitude
camzoom(ax,1.5) % zoom in a bit, camzoom is cumulative
% zoom_factor within [0 1) zooms out zoom_factor>1 zooms in
ax2.CameraTarget = [500 500 0]; % centring

abs(s11(sub2ind(size(V),nd1,nd2)))
unique(sort(drange(nd1)))
numel(nd1)
among these stub lengths
D1=unique(drange(nd1))
D2=unique(drange(nd2))
the stub lengths inside D<.5 are the smallest ones
Dstub1= D1([1 2])
Dstub2= D2([1 2])
= 0.001390798787950
0.001390798787950
0.002883920448033
0.002883920448033
0.001390798787950
0.001390798787950
0.002883920448033
0.002883920448033
= 0.1470 0.3530 0.6470 0.8530
= 8
= 0.1470 0.3530 0.6470 0.8530
= 0.1740 0.4820 0.6740 0.9820
Dstub1 = 0.1470 0.3530
Dstub2 = 0.1740 0.4820

D1= D1([1 2]) % series transmission line
D2= D2([2 1]) % series oc stub
s11=zeros(1,numel(f));s11_mod=zeros(1,numel(f));
L1=D1*c0/f0
L2=D2*c0/f0
ZinTL=Z0*(ZL+1j*Z0*tan(2*pi*L2(1) *f/c0))./(Z0+1j*ZL*tan(2*pi*L2(1) *f/c0));
Zin_stb_oc=Z0./(1j*tan(2*pi*L1(1)*f/c0)); % open stub
Zin=ZinTL+Zin_stb_oc;
s11_mod=abs((Zin-Z0)./(Zin+Z0));
figure(2);plot(f,s11_mod);grid on
hold all
ZinTL=Z0*(ZL+1j*Z0*tan(2*pi*L2(2) *f/c0))./(Z0+1j*ZL*tan(2*pi*L2(2) *f/c0));
Zin_stb_oc=Z0./(1j*tan(2*pi*L1(2)*f/c0)); % open stub
Zin=ZinTL+Zin_stb_oc;
s11_mod=abs((Zin-Z0)./(Zin+Z0));
figure(2);plot(f,s11_mod);grid on

quick check how short circuit and open circuit stubs behave over frequency:
Zin_sc_stub=1j*Z0*tan(beta*L)
Zin_oc_stub=-1j*Z0*cot(beta*L)
quick check how short circuit and open circuit stubs behave over frequency:
Zin_sc_stub=1j*Z0*tan(beta*L)
Zin_oc_stub=-1j*Z0*cot(beta*L)
da=pi/2000;a=[-2*pi:da:2*pi];
y_OC=-cot(a); y_SC=tan(a);
figure;plot(a,y_OC,a,y_SC);
grid on;axis([-2*pi 2*pi -10 10])
legend('SC','OC')
ylabel('Stub Z_i_n');xlabel('\betaL')
xticks([-2*pi -2*pi*3/4 -pi -pi/2 0 pi/2 pi 3*pi/2 2*pi])
xticklabels({'-2\pi','-3\pi/4','-\pi','-\pi/2','0','\pi/2','\pi','3\pi/2','2\pi'})
