exercise 5.9
ZIP with MATLAB scripts and note:
exercise 5.9 notes:

Analytic solution with a surface
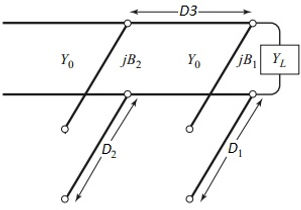
Z0=50;ZL=Z0/(.4+1j*1.2);D3=1/8;
Dstep=.001;drange=[0:Dstep:1];
D1=drange;D2=D1;
Zin4=zeros(numel(drange),numel(drange));
s11=zeros(numel(drange),numel(drange));
for k=1:1:numel(D1)
for s=1:1:numel(D2)
Zin_stub1=Z0./(1j*tan(2*pi*D1(k)));
Zin2=(Zin_stub1.^-1+ZL.^-1).^-1;
Zin3=Z0*(Zin2+1j*Z0*tan(2*pi*D3))./(Z0+1j*Zin2*tan(2*pi*D3));
Zin_stub2=Z0./(1j*tan(2*pi*D2(s)));
Zin4(k,s)=(Zin_stub2.^-1+Zin3.^-1).^-1;
s11(k,s)=(Zin4(k,s)-Z0)/(Zin4(k,s)+Z0);
end
end
abs(s11);
hf1=figure(1);hs1=surf(D1,D2,abs(s11))
ax1=hf1.CurrentAxes;ax1_backup=ax1
hs1.LineStyle='none'
xlabel('D2');ylabel('D1')
campos([.5 .5 9.1602])
ax1.PlotBoxAspectRatio=[1 1 1]
hold(ax1,'on')
n0=find(drange==.5) % plotting corner to box D1<.5 D2<.5
plot3(ax1,[drange(n0) drange(n0) 0],…
[0 drange(n0) drange(n0)],[5 5 5],'Color',[1 0 0],'LineWidth',3)


Conditioning surface to capture peaks, it's useful that the peaks are sharper than just 1./abs(s11):
V=1e3*del2(abs(s11));
hf2=figure(2);ax2=gca;surf(V,'Lines','none');xlabel('D1');ylabel('D2');
ax2.XTickLabelMode='manual';
ax2.XTickLabel=[0:0.1:1];ax2.YTickLabel=[0:0.1:1];
ax2.XTick=[0:100:1000];ax2.YTick=[0:100:1000];
[pks,locs]=findpeaks(V(:),'MinPeakHeight',9,'MinPeakDistance',200);
[nd1,nd2]=ind2sub(size(V),locs);
hold all;plot3(nd2,nd1,V(nd2,nd1)+2,'ro'); % verifying peaks locations
plot3(ax2,[drange(n0) drange(n0) 0],…
0[0 drange(n0) drange(n0)],[5 5 5],'Color',[1 0 0],'LineWidth',3)
D1=unique(sort(D1(nd1)))
D2=unique(sort(D2(nd2)))
abs(s11(sub2ind(size(V),nd1,nd2))) % |s11| linear values
D_surf=[D1;D2]
taking only stub lengths below lambda/2
D_surf=D_surf([1 2],[1 2])
D11*360
D12*360
findpeaks options minpeakheigh and mineapkdist manually trimmed to avoid getting too many peaks
numel(nd1)
V(sub2ind(size(V),nd1,nd2))
the |s11| linear values onmatch points:
abs(s11(sub2ind(size(V),nd1,nd2)))
1st solution, stubs with lengths below 0.5:
D11=0.086
D12=0.375
2nd solution
D21=0.199
D22=0.375
Not mentioned in the solutions manual, but choosing the shortest stubs doesn't mean stubs longer than lambda/2 are not perfectly valid.
One can manually change the view point with the rotate button on the figure window toolbar:

=
Columns 1 through 3
0.086000000000000 0.375000000000000 0.586000000000000
Column 4
0.875000000000000
=
Columns 1 through 3
0.199000000000000 0.375000000000000 0.699000000000000
Column 4
0.875000000000000
D_surf =
0.0860000 0.3750000 0.5860000 0.8750000
0.1990000 0.3750000 0.6990000 0.8750000
D_surf =
0.086000000000000 0.375000000000000
0.199000000000000 0.375000000000000
= 1.350019397711374e+02
= 30.957734133059738
= 8
=
15.367723269270918
15.367723269272101
10.995122045537965
10.995122045537279
15.367723269270671
15.367723269271853
10.995122045537727
10.995122045537039
=
0.006499310969800
0.006499310969799
0.000000000000001
0.000000000000001
0.006499310969801
0.006499310969800
0.000000000000001
0.000000000000001

for loops are faster than compact but slower expressions
The direct assault, without double for loops, with my current platform, imposes a drastic reduction in the D1 D2 resolution steps, both up to 0.01, and it takes about 10 fold more time to produce result than with the double for.
Dstep=.01;drange=[0:Dstep:1];
[D1,D2]=meshgrid(drange,drange);
Zin_stub1=Z0./(1j*tan(2*pi*D1));
Zin2=(Zin_stub1.^-1+ZL^-1).^-1;
zin3=Z0*(Zin2+1j*Z0*tan(2*pi*D3))./…
(Z0+1j*Zin2*tan(2*pi*D3));
Zin_stub2=Z0./(1j*tan(2*pi*D2));
[Zin_stub2,Zin3]=meshgrid(zin_stub2,zin3);
Zin4=((Zin_stub2.^-1.+Zin3.^-1).^-1);
s11=(Zin4-Z0)./(Zin4+Z0);

When attempting even a modest d=0.001 without double for loop a serious RAM shortage takes place:
and d=0.0001
Apparently 'smart' compact nice looking expressions sometimes require more processing capacity than equivalent vectorised expressions.
'Looking smart' goes after 'being smart' not the other way round.
Error using repmat
Requested 1002001x10001 (149.3GB) array exceeds maximum array size
preference. Creation of arrays greater than this limit may take a
long time and cause MATLAB to become unresponsive. See array size
limit or preference panel for more information.
Error in meshgrid (line 58)
xx = repmat(xrow,size(ycol));
Error using repmat
Requested 100020001x10001 (14905.6GB) array exceeds maximum array size preference …
With Smith Chart
1st OC stub, next to load, 1st shortest length:
Z0=50;ZL=Z0/(.4+1j*1.2);
hf3=figure(3);sm3=smithchart; ax3=hf3.CurrentAxes;hold(ax3,'on')
gammaZL=(ZL-Z0)/(ZL+Z0); % mark ZL
[gammaZL_angle,gammaZL_mod]=cart2pol(real(gammaZL),imag(gammaZL))
hold all;plot(real(gammaZL),imag(gammaZL),'ro','LineWidth',1.5);
YL=1/ZL;
gammaYL=(YL-1/Z0)/(YL+1/Z0); % mark YL, no need to switch to Y Smith chart
[gammaYL_angle,gammaYL_mod]=cart2pol(real(gammaYL),imag(gammaYL))
plot(real(gammaYL),imag(gammaYL),'go','LineWidth',1.5);
D3=1/8; % stretch of TL between stubs
1st shunt stub circle
[xc1,yc1]=Smith_plotStubCircle(ax,1/Z0,D3,[0 1 1]);
[x_r1,y_r1]=Smith_plotRcircle(ax,Z0^2/ZL,Z0,[1 0.5 .5]);
[px1,py1]=intersections(xc1,yc1,x_r1,y_r1); % constant R circle for YL
plot(px1,py1,'bo');
Left hand side of YL 1st intersection:
gammaY11=px1(1)+1j*py1(1)
reverse reflection coeff to admittance
gammaZ11=-gammaY11
z11=(1-gammaZ11)/(1+gammaZ11)
y11=1/z11
Y11=y11/Z0
[x_Barc_stub11_1,y_Barc_stub11_1]=Smith_plotBarc(ax3,YL,1/Z0,[1 0 0])
[x_Barc_stub11_2,y_Barc_stub11_2]=Smith_plotBarc(ax3,1/Y11,Z0,[1 0 0])
[dX11,arcSC_stub11]=Smith_arcStub(ax3,gammaYL,gammaY11,Z0,1,[0 0 1])
y11_stub1=-1j*dX11/Z0
D11=atan(y11_stub1/1j)/(2*pi)
if D11<0 D11=D11+.5; end
D11
D11*360


gammaY11 = -0.399969149078284 + 0.200061529810982i
gammaY12 = 0.461478371609742 + 0.692294433963756i
D11 = 0.375005388253159
=
1.350019397711374e+02
1st OC stub, 2nd shortest length:
hf4=figure(4);sm4=smithchart;
ax4=hf4.CurrentAxes
hold(ax4,'on')
plot(ax4,real(gammaZL),imag(gammaZL),'ro','LineWidth',1.5);
plot(ax4,real(gammaYL),imag(gammaYL),'go','LineWidth',1.5);
[xc1,yc1]=Smith_plotStubCircle(ax4,1/Z0,D3,[0 1 1]);
plot constant r=1 circle shifted l/8 towards generator on Y Smith chart 180deg shifted
[x_r1,y_r1]=Smith_plotRcircle(ax4,Z0^2/ZL,Z0,[1 0.5 5]);
plot(ax4,px1,py1,'bo');
1st intersection 2nd point, on Smith chart right hand side to YL, shunt stub has to shift impedance YL to Y12 CW, d=1
gammaY12=px1(2)+1j*py1(2)
gammaZ12=-gammaY12
from reflection coeff to admittance
z12=(1-gammaZ12)/(1+gammaZ12)
y12=1/z12;Y12=y12/Z0
[x_Barc_stub12_1,y_Barc_stub12_1]=Smith_plotBarc(ax4,YL,1/Z0,[1 0 0])
[x_Barc_stub12_2,y_Barc_stub12_2]=Smith_plotBarc(ax4,1/Y12,Z0,[1 0 0])
[dX12,arcSC_stub12]=Smith_arcStub(ax4,gammaYL,gammaY12,Z0,-1,[0 0 1])
y12_stub1=1j*dX12/Z0
D12=atan(y12_stub1/1j)/(2*pi)
if D12<0 D12=D12+.5; end
D12
ADS by default supplies stub length results in degree
D12*360

D12 = 0.08599370592516
= 30.957734133059738
2nd OC stub, 1st shortest length:
hf5=figure(5);sm5=smithchart;
ax5=hf5.CurrentAxes
hold(ax5,'on')
plot(ax5,real(gammaZL),imag(gammaZL),'ro','LineWidth',1.5);
plot(ax5,real(gammaYL),imag(gammaYL),'go','LineWidth',1.5);
plot(ax5,px1,py1,'o','Color',[.6 .6 1]); % intersection points for 1st stub
Smith_plotStubCircle(ax5,1/Z0,D3,[.7 1 1]);
% r=1 circle rotated lambda/8 away from generator Y Smith chart
D3_TLshift=pi/4 % TL shift lambda/8 in rad
a1=-2*D3_TLshift % D3 shift on Smith chart, towards generator on Y Smith chart
rotation matrix
G=[cos(a1) -sin(a1);sin(a1) cos(a1)];
Y11=y11/Z0;Y12=y12/Z0;
[x_GCz21,y_GCz21]=Smith_plotGammaCircle(ax5,1/Y11,Z0,[1 .8 .8]);
[x_GCz22,y_GCz22]=Smith_plotGammaCircle(ax5,1/Y12,Z0,[1 .8 .8]);
constant resistance circle g=re(YL)
[x_r1,y_r1]=Smith_plotRcircle(ax5,Z0^2/ZL,Z0,[1 0.5 .5]);
Pc2=G*[xc1;yc1] % rotating stub circle
xc2=Pc2(1,:);yc2=Pc2(2,:);
plot(ax5,xc2,yc2,'c') % circle r=1
P2=G*[px1';py1'] % rotating intersection points
px2=P2(1,:);py2=P2(2,:);
plot(ax5,px2,py2,'bo') % intersection points on r=1 circle
gammaY21=px2(1)+1j*py2(1)
gammaZ21=-gammaY21 % from reflection coeff to admittance
z21=(1-gammaZ21)/(1+gammaZ21)
Z21=z21*Z0
y21=1/z21
Y21=y21/Z0
[x_Barc_stub21,y_Barc_stub21]=Smith_plotBarc(ax5,1/Y21,Z0,[1 0 0])
[x_Barc_stub22,y_Barc_stub22]=Smith_plotBarc(ax5,0,Z0,[1 0 0])
[dX21,arcSC_stub21]=Smith_arcStub(ax5,-1,gammaY21,Z0,-1,[0 0 1])
y21_stub2=-1j*dX21/Z0 % -1 quick fix, pending more robust fix
D21=atan(y21_stub2/1j)/(2*pi)
if D21<0 D21=D21+.5; end; D21

D21 = 0.374993889549368

hf6=figure(6);sm6=smithchart;
ax6=hf6.CurrentAxes
hold(ax6,'on')
plot(ax6,real(gammaZL),imag(gammaZL),'ro','LineWidth',1.5);
plot(ax6,real(gammaYL),imag(gammaYL),'go','LineWidth',1.5);
plot(ax6,px1,py1,'o','Color',[.6 .6 1]); Smith_plotStubCircle(ax6,1/Z0,D3,[.7 1 1]);
[x_GCz21,y_GCz21]=Smith_plotGammaCircle(ax6,1/Y11,Z0,[1 .8 .8]);
[x_GCz22,y_GCz22]=Smith_plotGammaCircle(ax6,1/Y12,Z0,[1 .8 .8]);
[x_r1,y_r1]=Smith_plotRcircle(ax6,Z0^2/ZL,Z0,[1 0.5 .5]);
% constant resistance circle g=re(YL)
plot(ax6,xc2,yc2,'c') % r=1 circle
plot(ax6,px2,py2,'bo') % intersection points on r=1 circle
gammaY22=px2(2)+1j*py2(2)
gammaZ22=-gammaY22
z22=(1-gammaZ22)/(1+gammaZ22)
Z22=z22*Z0
y22=1/z22
Y22=y22/Z0
[x_Barc_stub12_2,y_Barc_stub12_2]=Smith_plotBarc(ax6,1/Y22,Z0,[1 0 0])
[x_Barc_stub12_2,y_Barc_stub12_2]=Smith_plotBarc(ax6,Z0,Z0,[1 0 0])
[dX22,arcSC_stub22]=Smith_arcStub(ax6,-1,gammaY22,Z0,1,[0 0 1])
y22_stub2=1j*dX22/Z0
D22=atan(y22_stub2/1j)/(2*pi)
if D22<0 D22=D22+.5; end
D22
D22*360
D22 = 0.198792933210378
= 71.565455955736013
I'm a paragraph. Click here to add your own text and edit me. It's easy.
Frequency Response
c0=2.998e8;f0=2e9;
df=1e6;f1=1e9;f2=3e9;f=[f1:df:f2];D_11=drange;
Putting all stub lengths together in same matrix
D=[D11 D12;D21 D22]
a1=atan(D11/D21)
a1*180/pi
close(hf1)
D1=drange;D2=D1;
hf1=figure(1);hs1=surf(D1,D2,abs(s11))
ax1=hf1.CurrentAxes;ax1_backup=ax1
hs1.LineStyle='none'
xlabel('D2');ylabel('D1')
ax1.PlotBoxAspectRatio=[1 1 1]
hold(ax1,'on')
plot3(ax1,[drange(n0) drange(n0) 0],[0 drange(n0) drange(n0)],…
[1 1 1],'Color',[1 0 0],'LineWidth',3)
check what way cross sections should go.
plot3(ax1,[0 3*D21],[0 3*D11],[1 1],'-r','LineWidth',1.5)
plot3(ax1,[0 5*D22],[0 5*D12],[1 1],'-r','LineWidth',1.5)
plot3 pushes camera position away, but only for certain data, just to avoid the resulting view point being left in the middle of the data. The following 2 lines restore cam pos to bird eye position used at the beginning of this script.
campos(ax1,10*[0 0 100]);
camroll(ax1,-45) % input angle in degree
D = 0.375005388253159 0.085993705925166
0.374993889549368 0.198792933210378
= 0.785413495017266
= 45.000878437108625

a1=atan(D11/D21)
a1*180/pi
if a1>pi/4
p=[1 floor(numel(drange)*D21/D11);1 numel(drange)]; end
if a1<pi/4
p=[1 numel(drange);1 floor(numel(drange)*D11/D21)]; end
if a1==pi/4 p=ones(2); end
p=p';
ny1=floor(linspace(p(1,1),p(2,1),max(abs(p(1,1)-p(2,1))+1,…
abs(p(1,2)-p(2,2))+1)));
nx1=floor(linspace(p(1,2),p(2,2),max(abs(p(1,1)-p(2,1))+1,…
abs(p(1,2)-p(2,2))+1)));
abs_S11=abs(s11);
abs_S11_xsection1=[]
for k=1:1:numel(nx1)
abs_S11_xsection1=[abs_S11_xsection1 abs_S11(nx1(k),ny1(k))];
end
hf201=figure(201);
subplot(2,1,1);plot(D_11(ny1),abs_S11_xsection1);grid on;xlabel('D2')
subplot(2,1,2);plot(D_11(nx1),abs_S11_xsection1);grid on;xlabel('D1')
a2=atan(D12/D22)
a2*180/pi
if a2>pi/4 p=[1 floor(numel(drange)*D22/D12);1 numel(drange)]; end
if a2<pi/4 p=[1 numel(drange);1 floor(numel(drange)*D12/D22)]; end
if a2==pi/4 p=ones(2); end
p=p';
ny2=floor(linspace(p(1,1),p(2,1),max(abs(p(1,1)-…
p(2,1))+1,abs(p(1,2)-p(2,2))+1)));
nx2=floor(linspace(p(1,2),p(2,2),max(abs(p(1,1)-p(2,1))+1,abs(p(1,2)-p(2,2))+1)));
abs_S11_xsection2=[]
for k=1:1:numel(nx1)
abs_S11_xsection2=[abs_S11_xsection2 abs_S11(nx2(k),ny2(k))];
end
hf202=figure(202);
subplot(2,1,1);plot(D_11(ny2),abs_S11_xsection2);grid on;xlabel('D2')
subplot(2,1,2);plot(D_11(nx2),abs_S11_xsection2);grid on;xlabel('D1')
= 0.785413495017266
= 45.000878437108625

= 0.408272819072597
= 23.392309422768086


Experiment, sweep Transmission line length between both stubs
In the last part of the script, not reproduced here because there's still an error pending correction, with a basic for loop that sweeps D3 between 1.1*l/8 and 0.75*l/8.
Resulting OC stub lengths stored in D_11 D_12 D_21 and D_22

