ZIP with MATLAB scripts and note:
exercise 6.4


exercise 6.4 notes:

c0=2.998792586
er=1
f1=4.9e9;f2=5.1e9;f0=5e9
Nf=1e6 % amount frequency points between f1 f2
df=abs(f1-f2)/(Nf+1) % frequency resolution
f=[f1:df:f2];
delta_f=f-f0;
lambda1=c0/f1;lambda2=c0/f2;lambda0=c0/f0
dlambda=abs(lambda1-lambda2)/(Nf+1)
lambda=[lambda2:dlambda:lambda1];
L=lambda0/2
RLoad=0;Rgen=50;
ZL=RLoad; % load assumed constant resistance over all band
Z0=Rgen;
beta=2*pi./lambda;
N=1e4
dL=L/N
D_right=[1:1:floor((N)/2)]/N;
D_left=.5-D_right;
% same as
% D_left=D_right([end:-1:1]);
Zin_right=1j*Z0*tan(2*pi/lambda0*D_right*lambda0);
Zin_left=1j*Z0*tan(2*pi/lambda0*D_left*lambda0);
% same as
% Zin_left=1j*Z0*tan(2*pi/lambda0*(1-D_right)*lambda0);
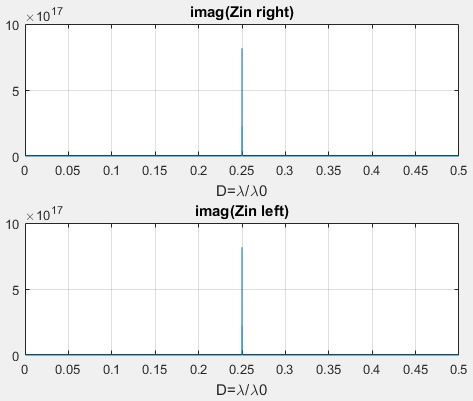
figure(1);
subplot(2,1,1);plot(D_right,imag(Zin_right));
grid on;title('imag(Zin right)');xlabel('D=\lambda/\lambda0')
subplot(2,1,2);plot(D_right,imag(Zin_left));
grid on;title('imag(Zin left)');xlabel('D=\lambda/\lambda0')
% it looks like as if ZRiight=ZLeft instead of the expected
ZRight=conj(ZLeft).
% The narrow spikes in previous graph hide the tagent is anti-symmetric
nnz(Zin_right==conj(Zin_left))
numel(Zin_right)
figure(2);
x = (-pi)+0.01:0.01:(pi)-0.01;
plot(x,tan(x)), grid on;axis([0 2*pi -200 200])
% The expected ZRight=conj(ZLeft) behaviour shows up considering
% ZL>0, for instance:
ZL=.1
Zin_right=Z0*(ZL+Z0*1j*tan(2*pi*D_right)./...
(Z0+ZL*1j*tan(2*pi*D_right)));
Zin_left=Z0*(ZL+Z0*1j*tan(2*pi*D_left)./...
(Z0+ZL*1j*tan(2*pi*D_left)));
% directly plotting does not really reveal that both graph lines
% are actually overlapped, because of really narrow impedance spikes.
figure(3);
subplot(2,2,1);plot(D_right,real(Zin_right));grid on;
title('real(Zin right)')
subplot(2,2,3);plot(D_right,imag(Zin_right));grid on;
title('imag(Zin right)')
subplot(2,2,2);plot(D_right,real(Zin_left));grid on;
title('real(Zin left)')
subplot(2,2,4);plot(D_right,imag(Zin_left));grid on;
title('imag(Zin left)')
% and now conjugate nature sought in the question clearly shows up.

